April 2019
abstract
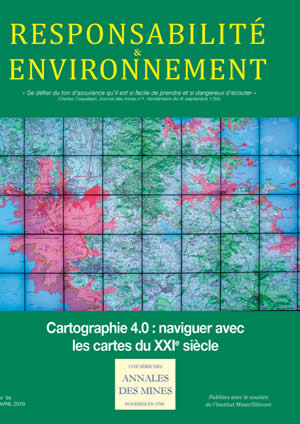
Responsabilité & Environnement
Cartographie 4.0 : naviguer avec les cartes du XXIe siècle
Issue editor:
Françoise ROURE et Didier PILLET
Issue 94
1 - Designing and making cartography 4.0
Earth System, an infrastructure research program of data and services on the cutting edge of digital imagery and cartography
By Frédéric HUYNH
Directeur de l’IR système Terre
Nicolas BAGHDADI
IRSTEA, directeur du pôle Theia
Michel DIAMENT
IPGP, directeur du pôle ForM@Ter
Nicole PAPINEAU
CNES, directrice du pôle AERIS
Gilbert MAUDIRE
IFREMER, directeur du pôle ODATIS
Richard MORENO
CNES, directeur technique IR système Terre
and Pierre MAUREL
IRSTEA, responsable Dinamis
Observe, understand and predict the history, operation and evolution of the Earth system, subject as it is to global changes, is a fundamental topic for research and a necessity for pursuing sustainable development goals. This calls for an interoperable infrastructure to speed up the extraction, analysis, diffusion and intelligent use of data, and for indicators and models derived from national and international systems of observation. Intended for scientists, public officials and innovators, these products and services are accessible via the Internet portals that, used for space missions and observation networks, support sustainable development. Coordinate, federate and optimize the existing set of institutions, arrangements and means are among the major ambitions of the Earth System program (IR Système Terre) with its European and international aspirations.
A new engine for 3D geospatial data visualization on Géoportail: iTowns
By Mirela KONINI
IGN
Alexandre DEVAUX
and Mathieu BRÉDIF
Université Paris-Est, LASTIG GEOVIS, IGN, ENSG
Visualization is a user-preferred mode of interaction for geographical information. An effective graphic representation of geographical data is all the more important when the data are massive and diverse, and when users and uses are varied. Moving beyond the 2D visualization on a map printed on paper or displayed on screen, 3D visualization raises new issues. Appropriate tools are needed to handle the volume of data and multiplicity of formats, and to manage the visualization and styles to be applied as well as interaction and browsing features. The IGN’s technological platform for visualizing geographical data in three dimensions on the Web, iTowns, proposes advanced features for interactions in a metrological environment. Initially designed by the IGN’s research laboratories for visualizing data from images and LiDAR (images coming from a moving vehicle equipped with sensors), iTowns has evolved and can now be used for immersively browsing a large volume of 3D data on a range of scales from space to ground level. Interfaces are available for manipulating the data. As the 3D visualization engine of Géoportail, iTowns is continually being endowed with new features. Besides 3D visualization for the general public, it can be used to develop professional Web applications for co-visualizing different types of data, annotating them, and then making analyses, measurements, etc.
The contribution of SIG 4D to a modern cartography for the 21st century
By Marie LACROIX
Docteur ès Géosciences – Géomatique
Owing to their universality, maps are fitting tools for communication and analytics. The visualization and mapping of spatial data are ever more present in everyday communications. The legacy of cartography is described along with this discipline’s current development as new techniques from information and communications technology are put to use: virtual reality, stereography, Anaglyph 3D, holography and 4D simulation. Cartography is continually undergoing changes that are making it easier to visualize phenomena not previously represented, such as underground networks or urban traffic flows. This opens the way toward designing tools for assisting decision-making in a wide range of fields.
Why Standards Matter – The objectives and roadmap of the International Open Geospatial Consortium (OGC)
By Mark REICHARDT, François ROBIDA
Open Geospatial Consortium (OGC)
The vision and mission of the Open Geospatial Consortium is discussed, with emphasis on its role to bring the power of location to decision makers around the world. OGC standards have significantly improved location information sharing worldwide and enable rapid integration of location data and technologies used in traditional mapping. OGC’s focus now is to improve decision making through the efficient application of location to a range of social, economic and environmental topics. OGC standards facilitate the rapid mobilization of new data sources (e.g. commercial imagery, Lidar) and new and disruptive technologies (e.g. IoT, autonomous and unmanned systems) to address challenges related to climate change, water resource availability, urban planning and management, insurance risk assessment, public safety, alternative energy placement, and land administration to name a few.
Geostatistics for building 3D geological models
By Didier RENARD
Christian LAJAUNIE
Centre de Géosciences, MINES ParisTech – PSL University
Simon LOPEZ
Direction Géoressources/Unité GSO (BRGM)
Cécile ALLANIC
Direction Géoressources/Unité GBS (BRGM)
Gabriel COURRIOUX
Bernard BOURGINE
Direction Géoressources/Unité GSO (BRGM)
and Philippe CALCAGNO
Direction Géoressources/Unité REG (BRGM)
By updating 2D geological cartography, 3D geological models will play a fundamental role in the Geological Survey of France. Models will be built using varied data on both surfaces and depths in order to make a coherent (but imperfect) representation of the subsoil. Model-builders will test and visualize hypotheses to back up interpretations. The tools designed and used by the Geological and Mining Research Bureau (BRGM) rely on geostatistical models. Based on geological correlations and stochastic fields, the potential field method, simple et flexible, coherently integrates data and assigns coefficients to cases of uncertainty. Far from being opposed, the interpretations made by geologists and stochastic representations can make use of each other.
On using real-time cartography in immersive cinema: The example of the partnership between ILOI and XD Productions
By Jacques PEYRACHE
PDG de la société XD Productions
and Alain SÉRAPHINE
Président de l’ILOI
The third dimension, which photogrammetry has brought to cartography, was first put to use by the army. By the 1990s, this technology was drawing the attention of private research. Since computer-generated images still had limited artistic and economic credibility, photogrammetry became a field of study for developing video games, cartoons, movies, etc. In this context, XD Productions, already busy with software for motion capture in 3D, oriented its research toward volumetric video and devised algorithms of real-time photogrammetry. It designed a studio capable of automatically building 3D models of movements in real time. To produce a first full-length film for demonstrating its innovation, XD Productions turned toward the Image Institute of the Indian Ocean (ILOI), which, as early as 1995, had started focusing on training and education in computer graphics as a tool for the development of the island of La Réunion.
Cartography and visualization
By Éric GUICHARD
Enssib
Maps seem to be everywhere since the growth of the Internet, but for production purposes, more attention has been given to visualization procedures, which raise methodological and epistemological questions that cover map-making. Visualization also uses complex, multidimensional, even massive data. The somewhat anarchic graphic semiotics has been reinvented since the emergence of a new occupation: designer-programmers. A promising space has been opened for a dialog where physicists, computer scientists and geographers discuss heuristic and epistemological advances in map-making and in visualization.
2 - Uses of Cartography 4.0
GeoBIM: From managing a territory to managing a building
By Dimitri SARAFINOF
Institut national de l’information géographique et forestière
Arnaud MISTRE
Guillaume PICINBONO
CSTB
Bruno VALLET
and Laurent HEYDEL
IGN
Accurate knowledge of a territory is a key element for its development and sustainable development. It involves precise modelling and mapping at different levels of scale, including buildings and interiors. The stakes are multiple: urban expansion, territorial development, transport and infrastructure... The GeoBIM approach combines the skills of modelling and representing buildings (BIM) and conventional mapping (Geo) domains in order to offer a global and multi-level approach to the need of sharing cartographic information. Research, standardization and experimentation activities contribute to this GéoBIM approach in order to converge on formats, tools and methods for exchanging this cartographic/geographic information necessary for the visualization, understanding and analysis of our environment and its development projects.
Digital land maps for transportation and mobility: Opportunities and issues?
By Yoann NUSSBAUMER
Chargemap
Cartography is breaking records thanks to smartphones, which have popularized the access to digital maps and been used to launch new transportation services. These services rely, in particular, on the advances made with sensors and on information from users, whether or not they are aware of this. The major players in map-making have gradually become megaplatforms of “mobility”, thus forcing traditional players on this market to revise their strategies. These changes raise questions about the ownership of cartographical data and the dissemination of users’ personal information. The answers are from evident…
High definition digital maps, mobility’s future: What value will be added to driverless vehicle systems?
By Vincent MARTINIER
TomTom France
From printed road maps to digital geolocation systems on touch screens, navigation has always been important, whether for the automobile industry or current forms of transportation (“mobility”). The cartography of highways is at the dawn of a new revolution. Its metamorphosis, which started twenty years ago, has come out of a combination of two major factors: geolocation by satellite and the digital transition. The purpose of road maps was to enable a driver to find the current position and provide a view of an itinerary for going from one point to another. In contrast, automatic steering systems are transferring more and more functions to artificial intelligence ‒ a transfer that will be complete with driverless vehicles, for which a new high-definition cartography will be essential. TomTom, a world leader in geolocation technology, is working on this…
Applications for analyzing AIS data and interactively geovisualizing data
By Damien LE GUYADER, Matthieu LE TIXERANT
Terra Maris
Relevant data are needed to carry out the EU’s maritime spatial planning program (MSP). Since maritime activities involve spatiotemporal interactions of conflict or of synergy, knowledge of them is indispensable; but obtaining the relevant data is a sensitive question. This overview of the methods and findings of several operational research programs seeks to show how the analysis of data from an automatic identification system (AIS) can produce information, adapted on various scales, for the MSP to use to describe maritime traffic (a ranking of sea lanes), fishing zones (as well as the presumed intensity of fishing), and interactions between uses of the sea. Elementary examples of an interactive geovisualization of the information thus produced are provided to make it easier to undertake an exploratory examination of the results.
Maps of farmlands and Farmstar’s services
By Philippe GATE, Baptiste SOENEN, Mathilde CLOSSET
Norbert BENAMOU
ARVALIS
Hervé POILVÉ
and Michel FEUGA
Airbus Defence and Space
Farmstar, an innovative service unique in the world, processes satellite images and runs agronomic models in order to assist farmers in making decisions about fertilizer inputs. Its success ‒ more than 16,000 subscribing farmers who work more than 700,000 hectares ‒ can be set down to the accuracy of its information about an element that is the major limitation (before water in France) on the quantity and quality on farm yields and that might be lowering the quality of the water supply (increasing nitrate concentrations in groundwater). The benefits are economic (higher yields, reduced inputs, better quality of the grain harvested), environmental and societal (by avoiding excess nitrogen input of any sort, by tracking and justifying farmers’ actions). Thanks to the zoning maps delivered to subscribers, farmers are able to vary doses of fertilizer as a function of plant needs in different parts of a single field. This much envied success story has come out of a cumulation of complementary skills and qualifications by agronomists at ARVALIS and experts in teledetection at Airbus.
Using emergency cartographical services by satellite for civil defense
By Stéphanie BATTISTON, Stephen CLANDILLON
Robin FAIVRE
ICube-SERTIT
Claire TINEL
CNES
and Annett WANIA
JRC
For several years now, satellites for observing the Earth have demonstrated their potential for assisting the management of natural or industrial disasters, not to mention humanitarian crises. Emergency digital mapping services have developed to provide geographical information based on satellite images to officials in change of risk prevention, crisis management and reconstruction. Several arrangements, now operational, provide regular support to civil defense services, humanitarian organizations, insurance companies and other organizations. The international charter “Space and Major Disasters” provides for mustering satellite resources to respond to catastrophes anywhere in the world. The EU’s EMS (Copernicus Emergency Management Service) offers, on request, maps to support disaster management operations, prevention work and reconstruction. Regional initiatives are also under way. France is a pioneer and major player in this field, owing to the actions of its space agency (CNES), its civil defense services and the speedy mapping services offered by ICube-SERTIT. The observation of the Earth is constantly evolving toward emergency digital mapping services for security purposes. While the major user is civil defense (for disaster management), other organizations are starting to integrate this technology in their action plans.
Observatoire de la Dynamique Côtière de Guyane: Its interactive map, a tool for the sustainable management of Guiana’s coast
By Julie FURIGA
Chargée de mission à l’Observatoire de la Dynamique Côtière de Guyane
A characteristic of French Guiana’s coast is unique in the world, namely the sedimentation and geomorphological processes stemming from the movement of banks of silt. To list sites where this is happening and develop and diffuse knowledge about this process, government agencies (DEAL and BRGM) set up an observatory in 2014: Observatoire de la Dynamique Côtière de Guyane (ODyC). In compliance with the national strategy for an integrated management of the coastline, the ODyC publishes all the data it collects. Modern tools, a website and a documentary database have been developed. Since September 2018, an interactive map (accessible via GéoGuyane) has been made in pursuit of the objective of federating all partners working on the coastline. These tools support a sustainable management of coastal areas in French Guiana.
The digital mapping of water basins: Feedback from water agencies
By Sarah FEUILLETTE, Patricia BLANC
Agence de l’eau Seine-Normandie
Given the number of parameters (chemical pollutants, bacteriological and physical information, the presence of wild- and plant life, data on the quantity of water, etc.) and the various scales (from the local diagnosis necessary for leisure activities to a general diagnosis at the scale of a river or a watershed that supplies an urban area), it is complicated to design water surveys and present their findings. Water agencies use digital tools to share information with the public and to involve the public in actions for updating water surveys. The Seine-Normandy Agency has just opened a website, Géo-Seine-Normandie, where users can now contribute to assessments of the water supply. The Rhône-Mediterranean-Corsica Agency manages (for itself and five others agencies) an application (Qualité Rivière) for access to data on the state of river water.
A regional platform’s impact on local cartographical practices
By Christine ARCHIAS
CRIGE Provence-Alpes-Côte d’Azur
Regional platforms of geographical information modify the practices of the local organizations that reuse and exploit geolocation data. The center of geographical information (CRIGE) in the Provence-Alps-Riviera region is the bridgehead of a network of such regional centers around AFiGéo. The assignments of these centers are to acquire, collect, integrate, diffuse and develop geographical data. As neutral, flexible, open organizations, they promote and facilitate cooperation, participatory experiences and innovative projects for producing and using geographical data. Thanks to their actions for opening data, for creating efficient tools to diffuse and exploit data and for developing user networks, these centers help modernize the processes and practices of map-making.
KaruGéo: Guadeloupe’s website of geographical information
By Anouk ROBILLARD
KaruGéo
As the Internet has developed, a clear need has been voiced at the international level for accessing and sharing geographical data. This fits into a trend toward transparency in public affairs. Over the past twenty years, infrastructures of geographical data (IDG) have been set up that diffuse information well beyond the bounds of the organizations that produce the information. By creating its own regional IDG, Guadeloupe has proven its determination to take part in circulating geographical information. KaruGéo, the website for this purpose, was set up in 2016. By pooling means, the state, regional and departmental councils, and the National Park of Guadeloupe have proposed a Web tool with a set of features for storing and circulating a legacy of regional data.
Digital cartography: Progress or a social cleavage?
By Claire TUTENUIT
Présidente de l’association Le Ruban Vert (www.lerubanvert.net) et déléguée générale de l’Association française des Entreprises pour l’Environnement (EpE)
At first sight, digital cartography seems to be a fantastic tool. Printed maps are obsolete and seldom republished. Besides, they are never in the right format or on the right scale. Digital maps are intended to handle these problems of access. With a simple click, anyone may obtain updated geolocation information from public or private service-providers. In actual practice however, things are not so simple…
Miscellany
How to put blockchain technology at the service of the Paris climate agreement
By Patrice GEOFFRON
Université Paris-Dauphine, PSL, Laboratoire d’Économie de Dauphine (LEDa) UMR-CNRS-IRD
and Stéphane VOISIN
Institut Louis Bachelier, PSL
Blockchain technology is used to store and convey information in a safe, transparent way and without a central control authority. The scope of experimentation with blockchains is vast, extending to the fight against climate change. What is this technology’s potential for accelerating the implementation of the Paris climate agreement? After all, a blockchain creates the conditions for transparency, increases the possibility of verifying data on greenhouse gas emissions and improves the interoperability of local initiatives. A “prototype” of a blockchain carbon registry is presented that the Caisse des Dépôts has designed in a partnership with the Climate Chain Coalition supported by UN Climate. The authors took part in initiating this coalition during the One Planet Summit held in Paris in December 2017.